
Historically, the international game was dominated by a duopolistic power structure between the United States and Germany. The United States holds the record for the most prolonged period of global dominance, leading the rankings for a total of 6,070 days, which included an uninterrupted seven-year tenure from March 2008 to December 2014. Germany stands as the second most dominant historical force, spending 1,701 days at the top. Prior to the structural changes witnessed around the 2023 World Cup cycle, the United States and Germany had held the top two ranking spots in almost every release, with only minor interruptions from nations such as Norway, Brazil, England, and Sweden.
The modern era, however, exhibits a highly dynamic fluctuation of the number-one spot, reflecting a narrowing competitive gap driven by the rapid professionalization of European domestic football. Throughout 2025 and early 2026, the battle for global supremacy has remained highly volatile. On March 6, 2025, the United States occupied the number-one position, closely trailed by Spain. The United States maintained this narrow lead through June 2025 , but a surge in European international play allowed Spain to reclaim the top spot in August 2025.
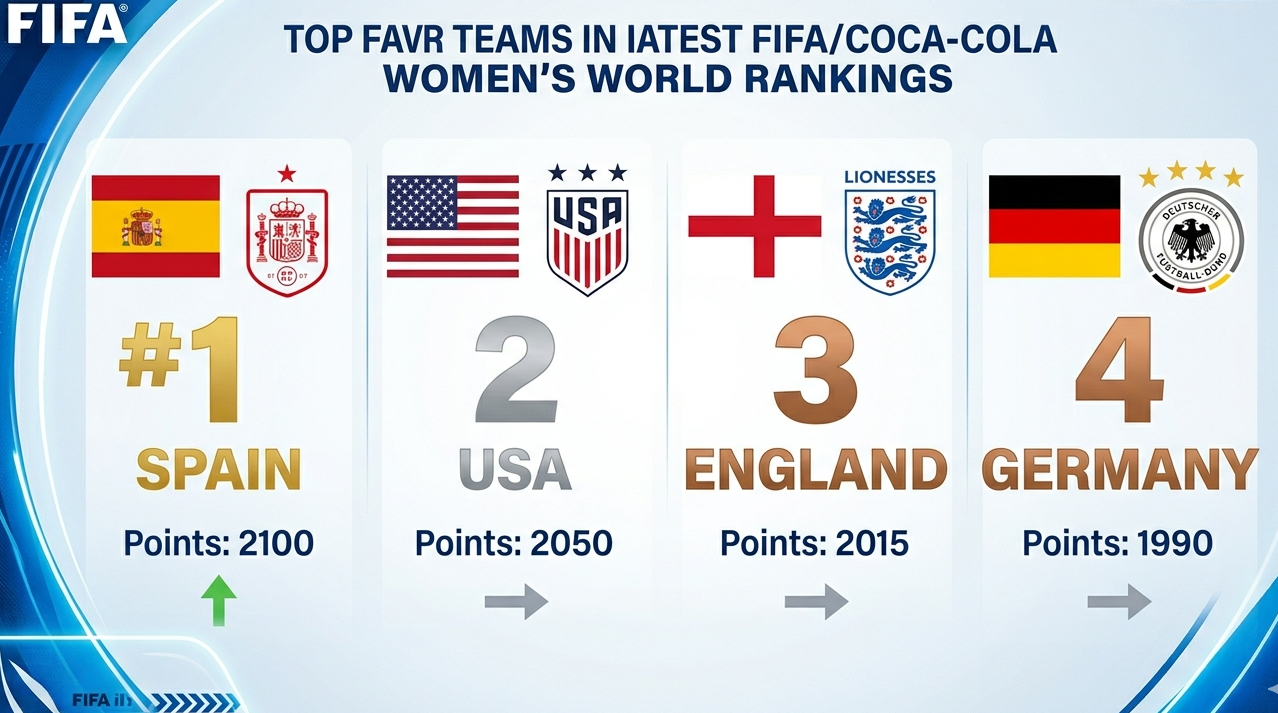
By December 11, 2025, Spain held firm at the summit , only for the United States to end the calendar year of 2025 in the lead. The ranking release on April 21, 2026, saw yet another shift, with Spain returning to the number-one position with 2083.09 points, while the United States, England, and Germany occupied the remaining top-four positions.
Table Of Contents
FIFA Women’s World Rankings Standings
The international hierarchy, as of the April 21, 2026 ranking release, illustrates the global distribution of power across multiple confederations.
| Rank | Team | Points | Change from December 2025 | Confederation | Historical Days at No. 1 |
|---|---|---|---|---|---|
| 1 | Spain | 2083.09 | Steady | UEFA | 548 Days |
| 2 | United States | 2054.65 | Steady | CONCACAF | 6,070 Days |
| 3 | England | 2038.72 | Increase 1 | UEFA | N/A |
| 4 | Germany | 2021.78 | Decrease 1 | UEFA | 1,701 Days |
| 5 | Japan | 2011.27 | Increase 3 | AFC | N/A |
| 6 | Brazil | 1980.00 | Steady | CONMEBOL | N/A |
| 7 | France | 1975.60 | Steady | UEFA | N/A |
| 8 | Sweden | 1961.22 | Decrease 3 | UEFA | 112 Days |
| 9 | Canada | 1934.88 | Increase 1 | CONCACAF | N/A |
| 10 | Netherlands | 1929.32 | Decrease 1 | UEFA | N/A |
This table reflects a highly competitive top-ten bracket where points differentials are increasingly marginal. The historical dominance of North America and Central Europe is actively being challenged by South American and Asian associations, preparing the ground for a highly unpredictable competitive cycle leading into the 2027 FIFA Women’s World Cup, scheduled to be hosted by Brazil.
Financial Architecture and Evolution of the FIFA Women’s World Cup
The rapid financial scaling of the FIFA Women’s World Cup represents a primary metric of the sport’s commercial expansion. Historically, the prize pools allocated to the women’s tournament were marginal, reflecting a systemic under-commercialization. In 2007, the total prize pool stood at $5.8 million, growing modestly to $7.5 million in 2011, and reaching $15 million for the 24-team edition in 2015. Under the administration of Gianni Infantino, the prize pool was doubled to $30 million for the 2019 tournament in France.
The most substantial financial leap occurred during the 2023 tournament cycle in Australia and New Zealand, where the pure prize pool surged to $110 million. This figure represents an increase of approximately 366.67% over the 2019 pool and is more than seven times the amount offered in 2015.
The “Total Prize Envelope”Controversy
While governing body leadership has frequently championed a tenfold increase in total funding since 2015, independent player unions and financial analysts have raised critical observations regarding the marketing of these figures. For the 2023 tournament, FIFA advertised a total financial package of $152 million. However, a closer examination of the financial structure reveals that this “envelope” was subdivided into distinct operational categories :
- Pure Prize Money: $110 million distributed based on sporting achievement.
- Preparation Funding: $31 million allocated to national associations to offset training, travel, and camp logistics.
- Club Benefits Programme: $11 million distributed to 1,041 professional clubs globally to compensate them for releasing players during the tournament window.
Analysts point out that in the 2015 World Cup cycle, there was no dedicated preparation funding or Club Benefits Programme; the $15 million allocation represented the entirety of FIFA’s financial disbursements. By combining these operational and preparatory expenses into the modern $152 million figure, institutional leadership has been critiqued for using inflated marketing narratives to suggest a 10x funding increase under current reigns, when the actual sporting prize pool grew by a factor of 7.3x.
The Re-engineered Revenue Distribution Model
A major structural advancement implemented in 2023 was the ring-fencing of player compensation, guaranteeing direct financial payouts to individual squad members rather than leaving distribution entirely to the discretion of national federations. In previous tournaments, national associations received lump-sum payments; for instance, U.S. Soccer was awarded $2 million for the national team’s victory in 2015 and $4 million for their title defense in 2019, with no global mandate governing how much of those funds reached the players.
In 2023, while qualifying associations received a baseline payment of $1.56 million, FIFA established a mandatory scale of direct player compensation based on tournament progression.
| Tournament Progression Stage | National Association Allocation (USD) | Guaranteed Direct Payment Per Player (USD) | Cumulative Player Pool Value (USD) |
|---|---|---|---|
| Group Stage Participation | $1,560,000 | $30,000 | $690,000 |
| Round of 16 | $1,870,000 | $60,000 | $1,380,000 |
| Quarter-Finalists | $2,180,000 | $90,000 | $2,070,000 |
| Fourth Place | $2,455,000 | $165,000 | $3,795,000 |
| Third Place | $2,610,000 | $180,000 | $4,140,000 |
| Runners-Up | $3,015,000 | $195,000 | $4,485,000 |
| Champions | $4,290,000 | $270,000 | $6,210,000 |
Under this model, the 2023 champions took home a total of $10.5 million, with $6.21 million of that sum divided directly among the 23 squad members ($270,000 per athlete), leaving the remaining $4.29 million for the winning national association. This mechanism protects players from domestic federation disputes, ensuring a stable, professional wage for competing at the highest level.
Systemic Inequalities and the Institutional Landscape
Despite the historic financial expansions of the recent cycle, the structural gap between the men’s and women’s global game remains a prominent point of contention. The $110 million prize pool for the 2023 Women’s World Cup represents only 25% of the $440 million prize pool allocated for the 2022 Men’s World Cup in Qatar. While Spain’s winning association in the women’s tournament was eligible for a $4.29 million payout, Argentina’s association received $42 million for winning the men’s tournament—a stark ten-fold disparity. This inequality is even more pronounced when contrasted historically: in 2018, the French men’s federation earned $38 million from a total pot of $400 million, while the U.S. women received just $4 million for their world championship run a year later.
This persistent gap catalyzed a coordinated campaign by player unions, spearheaded by the Australian women’s national team (the Matildas) and the Professional Footballers Australia (PFA) union. Prior to the 2023 tournament, all 23 members of the Australian squad released a collective video statement criticizing the global prize money discrepancy.
The players highlighted that while they had successfully negotiated a domestic collective bargaining agreement (CBA) with Football Australia guaranteeing equal revenue percentages for both the men’s and women’s national teams, this local progress was structurally undermined by the global financial inequalities established by FIFA.
The players’ union pointed out that FIFA held over $4 billion in financial reserves, arguing that the governing body had the immediate liquidity to equalize tournament payouts without waiting for commercial markets to mature. Institutional leadership, however, has consistently defended the current disparity by linking prize money growth to the commercial value of broadcast rights.
During the 73rd FIFA Congress in Rwanda, leadership criticized global broadcasters for submitting media rights bids that were 10 to 100 times lower than those offered for the men’s World Cup, asserting that public tax-funded broadcasters bore a social responsibility to provide equitable commercial valuations for the women’s game.
While FIFA has set an official target of absolute prize money parity for the 2026 Men’s and 2027 Women’s World Cups, player advocates note that the commitment contains strategic hedging. Governing bodies have repeatedly indicated that achieving this goal remains contingent on the willingness of commercial broadcasters and corporate sponsors to close the valuation gap, rather than committing to a flat equalization from internal reserves.
In the absence of global parity, smaller federations and local governments have occasionally intervened to offer localized solutions; for example, the Philippine government provided direct cash incentives of P50,000 per player for reaching the semifinals of the 2022 AFC Women’s Asian Cup, demonstrating localized efforts to support elite athletes.
Commercialization at the Club
Level: Broadcast Rights and Stadium Infrastructure
While international tournaments provide high-visibility showcases, the day-to-day economic health of women’s football is sustained by domestic professional leagues. The commercial evolution of these leagues is characterized by a transition from subsidy-dependent operations to self-sustaining entities capable of generating significant broadcast and sponsorship revenues.
The National Women’s Soccer League Broadcast Revolution
The National Women’s Soccer League (NWSL) in the United States executed a landmark commercial shift by securing a multi-partner media rights portfolio worth $240 million over four years, starting in 2024. This agreement yields an average of $60 million annually, representing a massive increase over previous valuations.
The NWSL’s broadcast strategy represents a shift away from exclusive, paywalled distribution models toward a hybrid model that balances direct monetization with broad accessibility. By dividing national coverage across multiple major networks, the league ensures consistent exposure throughout the season :
- Amazon Prime Video: Delivers premium digital streaming with exclusive coverage of Friday night regular-season matches.
- Scripps Sports (ION Network): Maximizes free, over-the-air television accessibility by hosting dedicated Saturday night doubleheaders.
- CBS Sports & Paramount+: Establishes mainstream linear presence, broadcasting a package of regular-season games alongside prime-time playoff coverage.
- ESPN Networks & ESPN+: Expands reach into diverse, multi-cultural markets by providing dual English and Spanish linear and digital streams.
This multi-distributor approach is highly strategic. By avoiding the mistake of placing all matches behind a single premium paywall, the NWSL has maximized its discoverability while preserving high economic value. This broad reach has driven a significant increase in franchise valuations, as evidenced by expansion fees rising to $125 million and clubs investing in dedicated, state-of-the-art practice facilities.
Comparative Infrastructure and Valuation Matrix
To contextualize the commercial scale of women’s professional sports, it is useful to examine the capital investments and infrastructure developments taking place across the NWSL and the WNBA.
| Metric | National Women’s Soccer League (NWSL) | Women’s National Basketball Association (WNBA) | Joint Market Implication |
|---|---|---|---|
| Media Rights Deal | $240 Million over 4 Years ($60M/year) | $200 Million primary network deal (escalating) | Broadcasters are pricing women’s sports as high-growth assets |
| Expansion Fee Baselines | $125 Million (e.g., Portland expansion) | Expanding franchise models with rising entry capital requirements | High franchise entry fees indicate strong long-term investor confidence |
| Dedicated Infrastructure Investments | Multi-million dollar custom team training centers | $38M (Chicago Sky), $64M (Seattle Storm), $100M+ (Phoenix Mercury) | Dedicated training facilities improve performance and player retention |
| Performance Standings / Competitiveness | Led by clubs like San Diego Wave FC (37 pts) | High-profile rookies driving unprecedented viewership | Star power combined with league parity maximizes commercial appeal |
This comparative landscape demonstrates that elite women’s leagues are successfully attracting high-net-worth investors who view these franchises not as charity projects, but as high-yield investment opportunities.